About SmartCGMS
SmartCGMS is a software-stack for the next generation of continuous glucose monitoring, controlling and research systems. Its architecture comprises a number of building blocks, which could be either real or simulated devices such as glucose-sensor, model of glucose dynamics and insulin pump. Simulation is an irreplaceable tool in the development of new methods and algorithms. Our software allows the user to define such simulation and later, when the new method is ready, just switch the simulated device for the real one with the same program code.
SmartCGMS architecture builds on the top of ideas of co-simulation and the High-Level Architecture standard. As insulin pump and mobile devices in general have limited computational resources and power supply, the architecture was simplified to allow adaptation to low-power devices.
SmartCGMS contains/supports the following in-silico models:
- Sirael
- Bergman-Hovorka-Willinska-Koutny model combination
- UVA/Padova S2013
- SimGlucose, by setting UVA/Padova S2013 xi parameter to zero
- T1DMS
- DMMS.R
Research
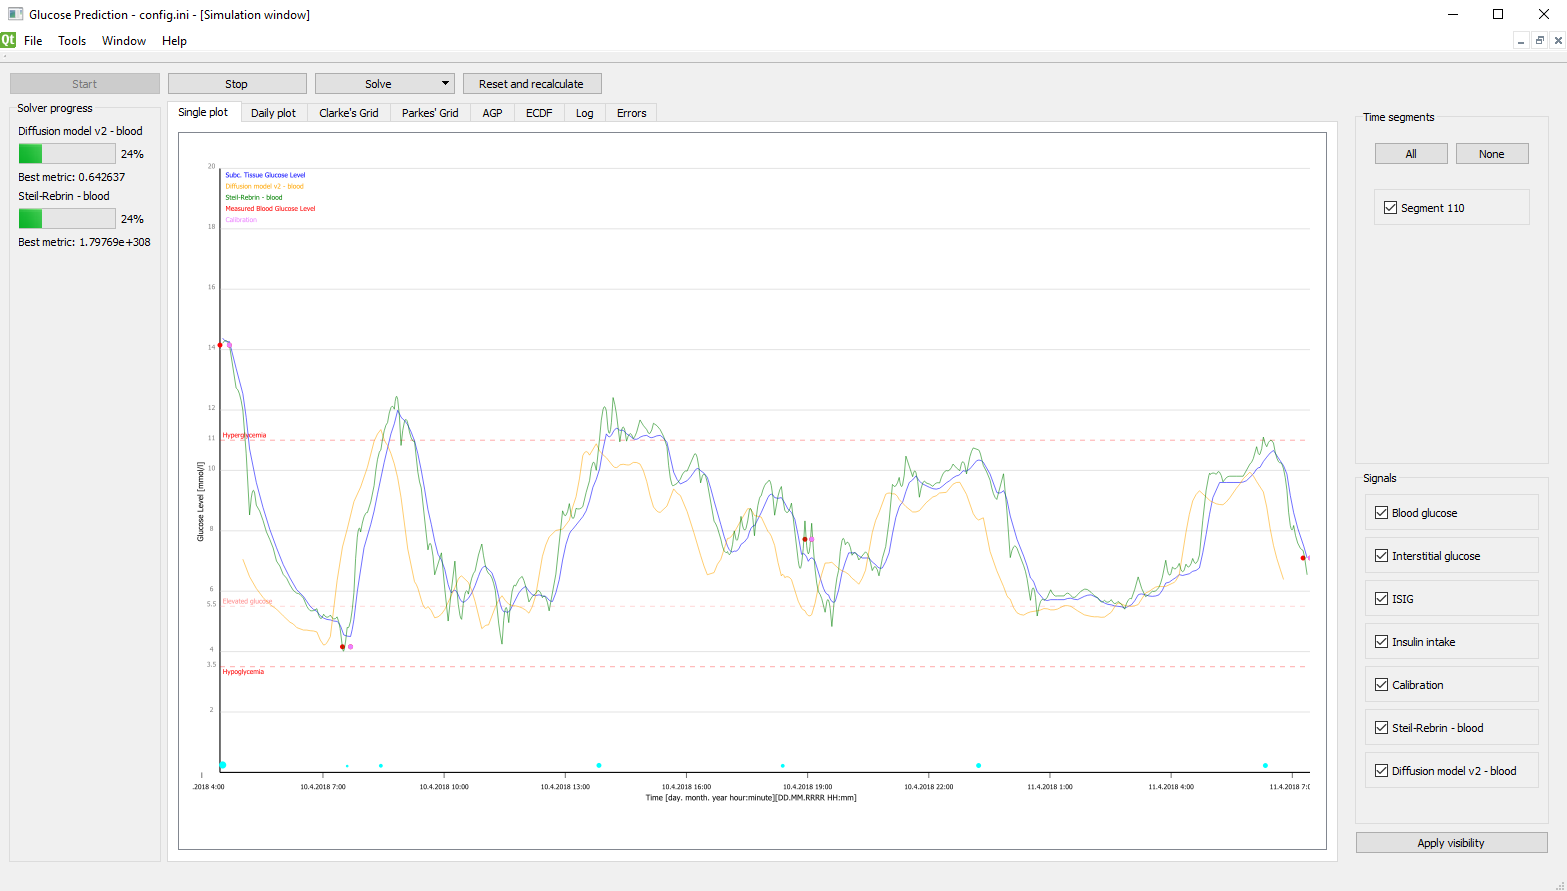
The research application comes in the graphical-user-interface and console variants. Graphical user interfaces lets a researcher to set up a simulation, including individual component parametrization. Once the simulation is set, the researcher can start it in the simulation view. Researcher can control the simulation during its runtime.
The research application visualize the results with graphs, plots and grids during the simulation - daily statistics, overall view, Parke's and Clarke's grids or ambulatory glucose profile, metrics and empirical cumulative distribution function of errors. Graphical user interface updates all of this in the real time, while offering additional filtering options. Entire experiment can be recorded and replayed as needed.
Generated graphs can be zoomed and saved to a vector-graphics file format.
Setting Up an Experiment
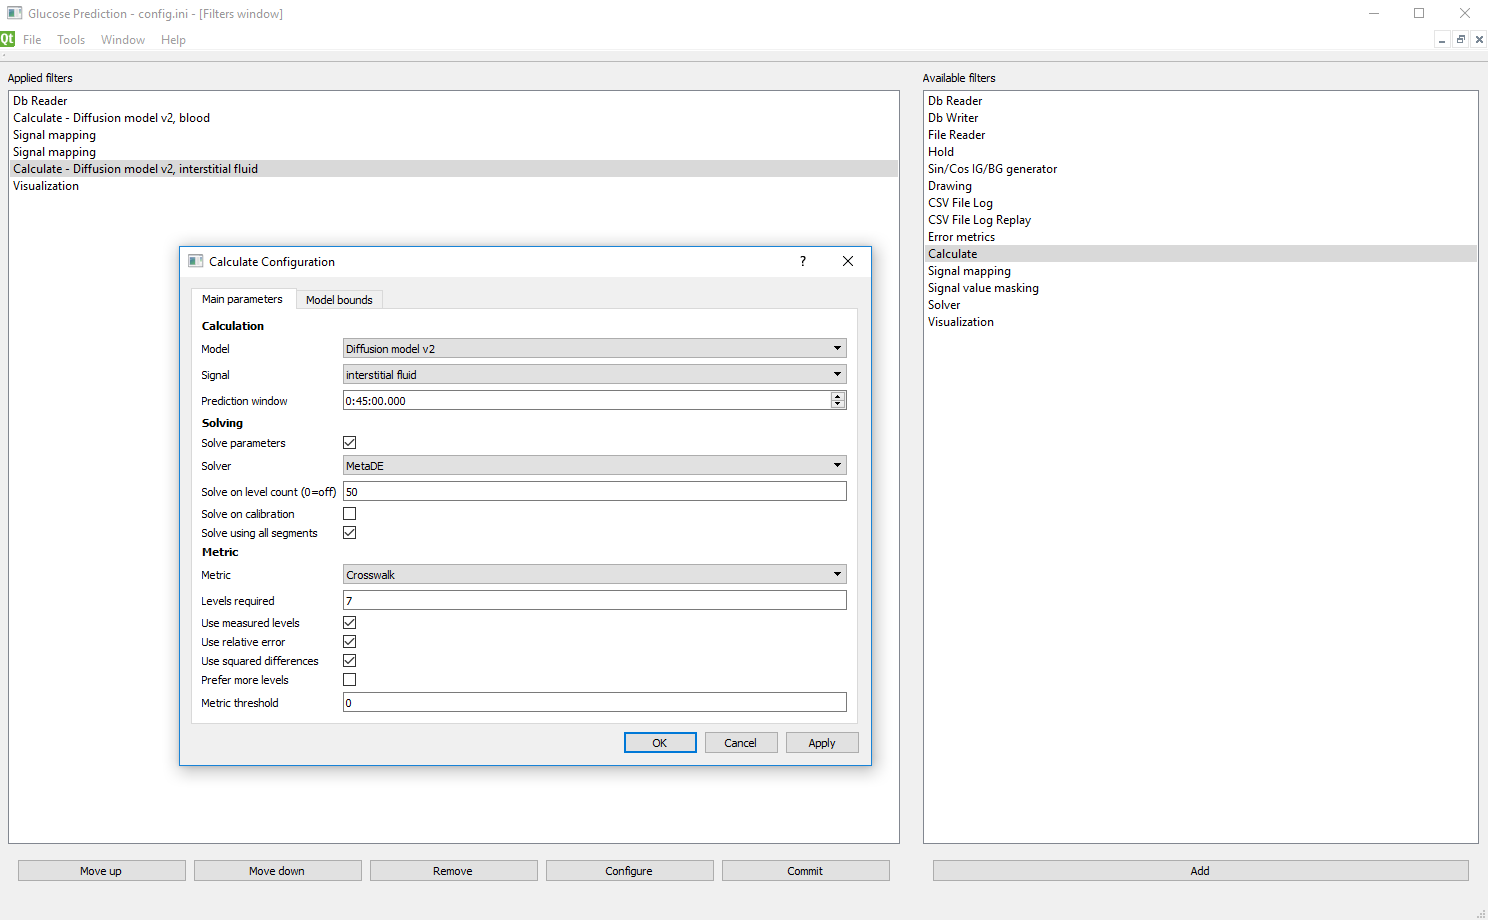
The graphical environment offers the configuration window, where the user can build custom configurations using predefined blocks, called filters. The right side contains available filters; the left side contains already selected filters. The order of filters is important - they are connected in a linear manner to a chain, with a simplex message passing. Nevertheless, it is possible to construct a complex chain by establishing feedback links.
Typically, the first filter in chain is a filter, which loads or generates input data. Such data may be loaded from a database, standard output file of CGM device or a log of previously simulated scenario. Then, calculation filters are defined. Such a filter schedules the solver algorithm to obtain model parameters. Then, the filter calculates the model signal using the determined parameters. In the graphical environment, visualization filter must be present to observe the calculated signal. This filter maintains graphical output, error metrics and simulation logging.
Detailed description of all available filters is present in documentation.
Installation
SmartCGMS open source codes are available at GitHub repository so that you can build it yourself.
Particularly, check-out the common, core, console and desktop repositories to the same parent directory. Then, just run the cmake for these repositories. The building environment should have the following prerequisities installed:
- compiler with C++17 (e.g.; gcc 7 or newer)
- CMake
- Qt 5 or 6
After a successful build, a bin subdirectory is created. It contains the following, important files and directories:
- gpredict3-desktop - research application with graphical user interface
- gpredict3-console - console version of the research application
- filters - directory containing filter libraries
Should you have any questions, just let us know.